
AI Coding Agents Moved the Bottleneck to Code Review: A Guide to the Harvard Paper
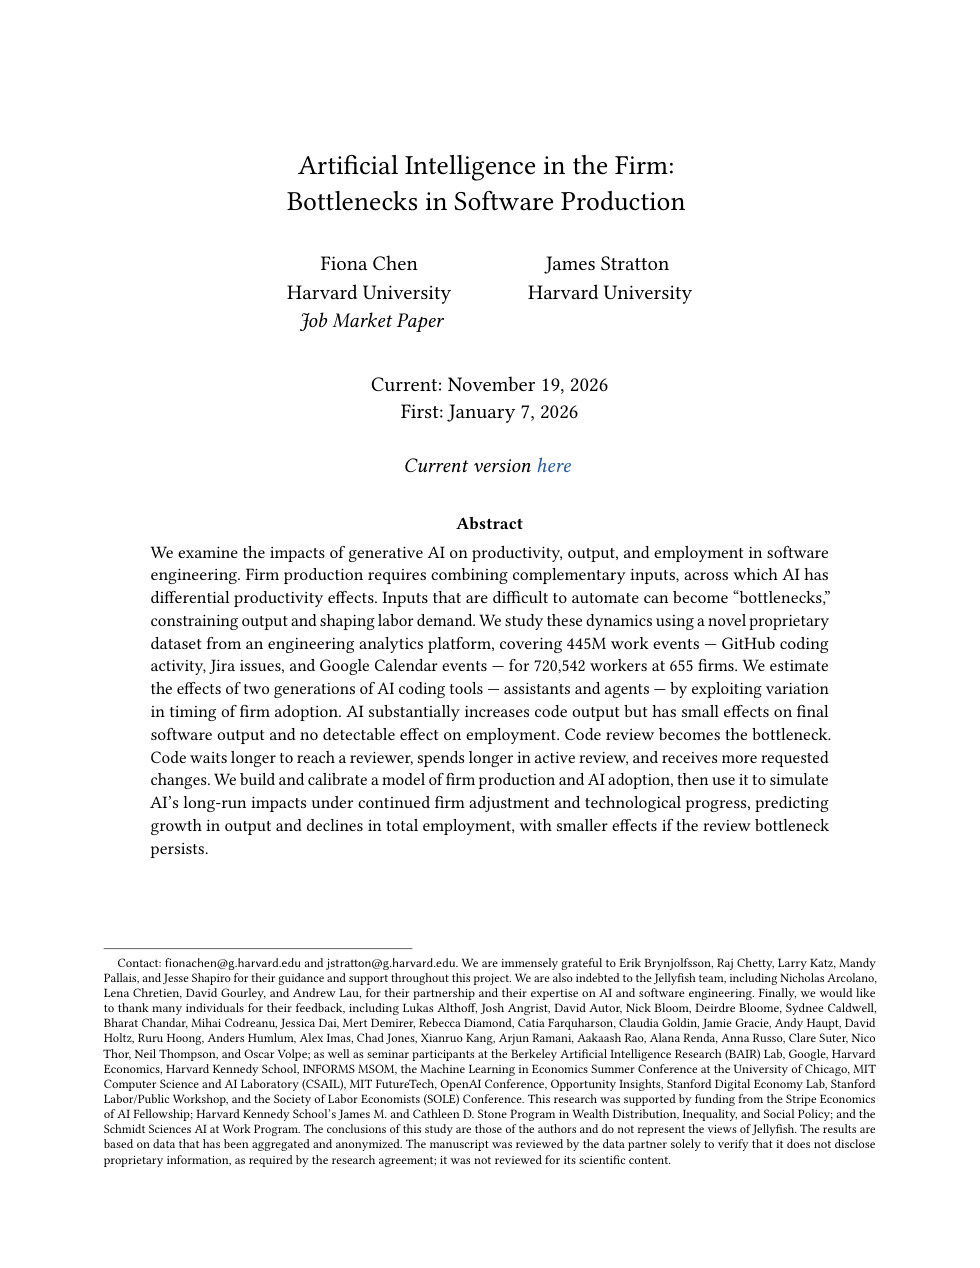
A Harvard job market paper on 655 firms says agents raised code output, moved finished work much less, and not significantly, and made review slower. This guide goes through the paper itself: what was measured, how big each number is, what changed between versions, what the Hacker News thread argued, and how to measure your own review queue before you buy more agent seats.

There are no affiliate links in this guide.
| Paper | Chen and Stratton, Harvard, version of Nov 19, 2026 |
| Cost | Free to read (PDF) |
| Data | 445M work events, 655 firms, Jellyfish |
| Catch | Proprietary data, not peer reviewed, numbers moved between versions |
| Evidence | Paper, news coverage, Hacker News thread |
The paper's most solid result is narrow: after firms adopted coding agents, code reached review faster than it left, and review took 56.1% longer. Treat the jobs and output forecasts as model output, not measurement.
Writing code got cheaper in this data. Reading it did not.
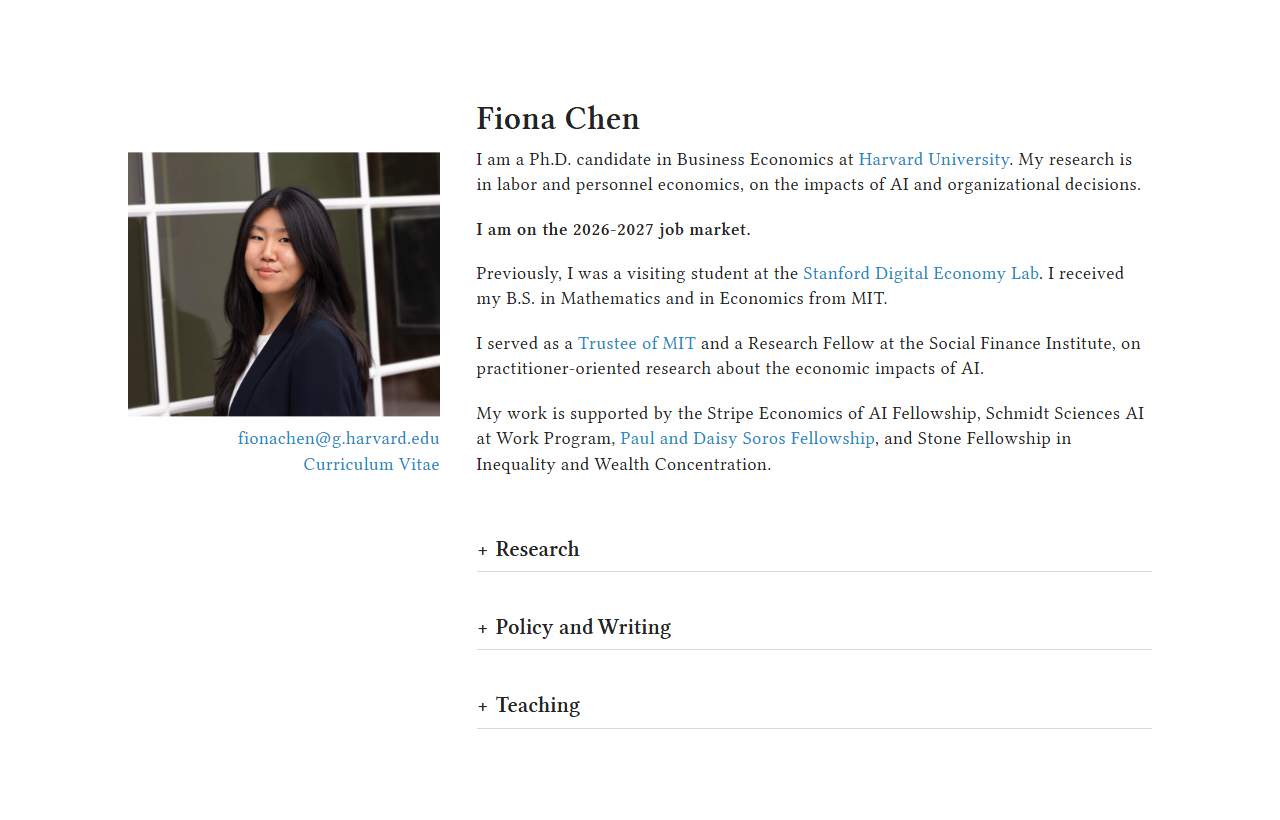
What it is. "Artificial Intelligence in the Firm: Bottlenecks in Software Production" is a job market paper by Fiona Chen and James Stratton at Harvard University. The PDF is dated Nov 19, 2026 (first version Jan 7, 2026). It follows 720,542 workers at 655 firms through 445 million work events from Jan 2021 to Aug 2026, supplied by the engineering analytics company Jellyfish.
Why it matters now. A Hacker News story linking ComplexDiscovery's coverage of the paper (story 50538303, submitted Nov 17, 2026) reached 328 points and 464 comments by Nov 21, and the submitter posted the PDF in a comment. For a team that is buying agent seats, it moves the question from "how much code can we write" to "how much can we review".
The catch. Three things. First, the data are proprietary and the paper is not peer reviewed as far as JAVIS can tell, so nobody outside can re-run it. Second, the measured effects at the firm level are for 12 months after adoption, when only about 35% of baseline coders at an adopting firm were detected using agents, and the paper calls its take-up figures a lower bound. Third, the numbers moved between versions: news coverage of an earlier version reports a 49% review slowdown on a 7.03 day baseline, while the Nov 19 version reports 56.1% on a 3.56 day baseline.
Not a hands-on test: JAVIS did not re-run the analysis, did not have access to Jellyfish data and did not test any coding agent for this guide. The evidence is the paper PDF, ComplexDiscovery's news analysis of an earlier version, and the Hacker News discussion, all as of Nov 21, 2026.
What you need to know in thirty seconds.
| Fit score part | Points of 20 |
|---|---|
| Data depth | 18 |
| Design care | 15 |
| Openness | 8 |
| Review status | 8 |
| Practical use | 16 |
| Total | 65 of 100 |
A staggered adoption study on a vendor's dataset, with the vendor reading the draft only for leaks.
The authors use a dataset from Jellyfish, a company whose analytics platform engineering teams use to track their own activity. It joins GitHub activity, Jira issues, Google Calendar events and usage records for GitHub Copilot, Cursor and Claude Code. The design compares firms by when they adopted AI tools (a staggered difference-in-differences). It rests on the assumption that, without adoption, early and late adopters would have followed similar paths. The authors argue that procurement approvals, legal and security review and pilots make adoption dates plausibly unrelated to growth, and they control for firm size because larger firms adopted earlier.
The paper separates two tool generations. Assistants (late 2022 onward) suggest code edits. Agents (from Cursor's agent in Nov 2024, then Claude Code in Feb 2025 and GitHub Copilot Agent in Apr 2025) take a task and carry out a sequence of steps. Most of the headline numbers below are for agents, measured as the extra effect on firms that already had assistants.
| Item | What the paper says |
|---|---|
| Sample | 445 million work events, 720,542 workers, 655 firms, Jan 2021 to Aug 2026 |
| Sources | GitHub (code), Jira (issues), Google Calendar (meetings), tool usage for Copilot, Cursor and Claude Code |
| Method | Staggered adoption comparison with firm size controls; event studies at 12 months |
| Take-up | Agents reach 35.30% of baseline coders 12 months after firm adoption; the paper says take-up figures are lower bounds |
| Funding | Stripe Economics of AI Fellowship, a Harvard Kennedy School program, Schmidt Sciences AI at Work Program |
| Data partner role | Jellyfish reviewed the manuscript only to check that no proprietary data was disclosed, not for scientific content |
| Status | Job market paper, version dated Nov 19, 2026; no sign of completed peer review |
Output of code rose in every measure. Output of finished work rose less, and the paper reports them as marginally insignificant.
Twelve months after adoption, firms that adopted agents show 44.0% more lines of code added (marginally insignificant), 36.0% more commits and 35.7% more pull requests opened, the last two statistically significant. Finished work is where the gain thins out. Jira issues resolved rise 13.7% and epics (larger features) 18.0%, both marginally insignificant, and the paper's confidence limits rule out increases above 30.7% for issues and 41.5% for epics. For assistants the finished-work effects are near zero: -1.5% on issues and 3.4% on epics.
The authors test the obvious escape route, that issues simply got bigger. They label issue text with a language model and a supervised predictor and find no change in average issue size, and they find no significant change in bug reports per worker. Employment is noisy: the point estimate for agents is -2.6% with a range from -15.6% to 10.5%, so the paper does not attribute job changes to AI.
Swipe sideways to see every column.
| Measure (month 12) | Assistants | Agents | Reading |
|---|---|---|---|
| Lines of code added | +30.4% | +44.0% | Marginally insignificant for both |
| Commits | +16.8% | +36.0% | Significant for both |
| Pull requests opened | +20.9% | +35.7% | Significant for both |
| Pull requests merged | +19.4% | +26.0% | Agents: only about 62.7% of the extra pull requests opened were merged |
| Jira issues resolved | -1.5% | +13.7% | Agents: marginally insignificant; assistants near zero |
| Jira epics resolved | +3.4% | +18.0% | Agents: marginally insignificant |
| Engineering employment | +3.0% | -2.6% | Wide ranges: -4.7 to 10.7 and -15.6 to 10.5 |
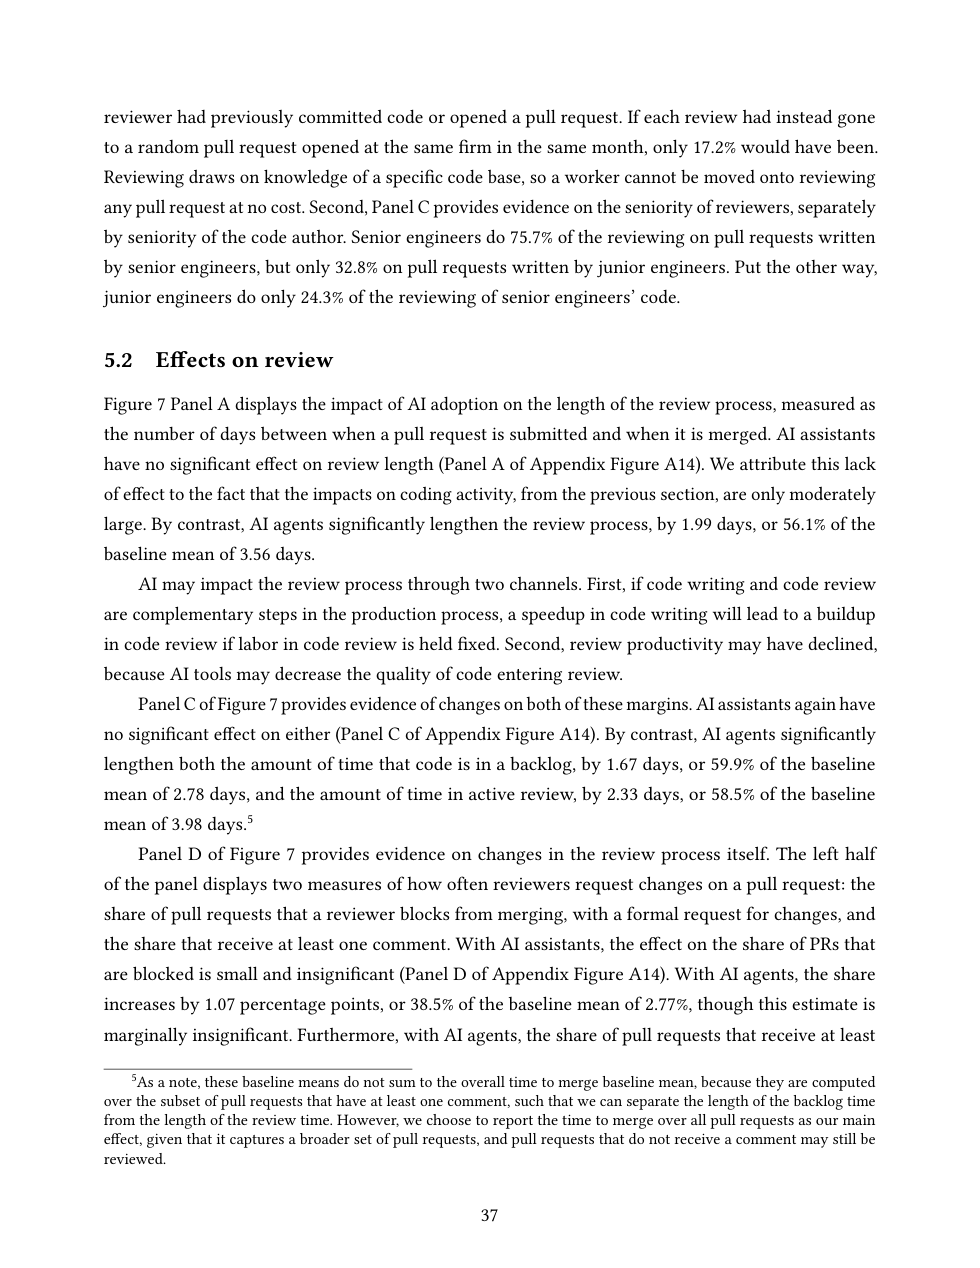
Time from submitting a pull request to merging it rose 1.99 days, from 3.56 to about 5.55.
This is the paper's central measured result. After firms adopted agents, the average time between submitting a pull request and merging it rose by 1.99 days, or 56.1% of a 3.56 day baseline. The paper splits the wait in two for pull requests that received a comment: time in a backlog before a reviewer starts rose 1.67 days (59.9% of 2.78), and time in active review rose 2.33 days (58.5% of 3.98). The authors read the first as a volume problem (more code into a fixed pool of reviewers) and the second as lower review productivity (code that needs more correction).
The review itself also gets heavier. Review comments per pull request rise 0.629, or 38.6% of a 1.63 baseline. The share of pull requests with at least one comment rises 4.61 points (13.1% of 35.17%, marginally insignificant), and the share formally blocked from merging rises 1.07 points (38.5% of 2.77%, marginally insignificant). The authors find no significant change in pull request size, which they use to argue the extra comments are not just bigger diffs. For assistants, none of these review effects is significant.
Reviewers mostly review code they already know, and seniors mostly review seniors.
The paper's argument for a review ceiling is that reviewing is not interchangeable labor. Firms do not hire separate writers and reviewers, but 82.8% of reviews are done by someone who had previously committed code or opened a pull request in that code base. If reviewers had been assigned at random inside the same firm and month, only 17.2% would have been. Seniority matters too: senior engineers do 75.7% of the reviewing on pull requests written by seniors, but only 32.8% of the reviewing on pull requests written by juniors. Put the other way, juniors do 24.3% of the reviewing of senior code.
Time use sets the other side of the ceiling. The paper estimates that engineers spend 40.8% of their time writing code when time is imputed from work signals, and 30.8% in a survey of 100 engineers recruited through Prolific. If coding is a third to two-fifths of the job, speeding up only that part runs into the rest, which is Amdahl's law applied to a team (JAVIS's comparison, not the paper's). An engineer interviewed in the paper describes a team where one senior could approve changes and could review once a week, and where new senior-approval rules after outages made it worse.
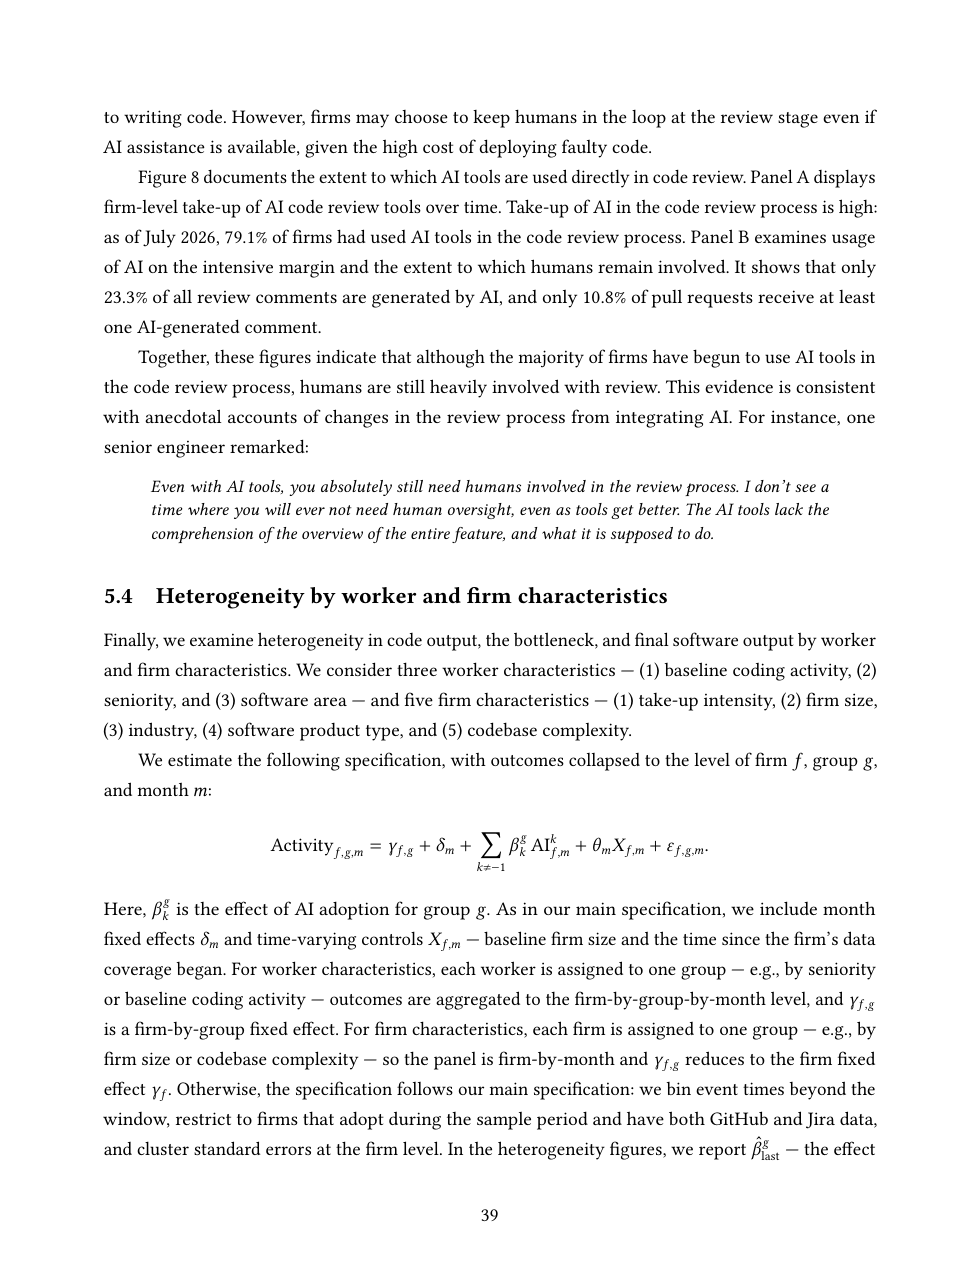
79.1% of firms use AI review tools, yet AI wrote 23.3% of review comments.
The obvious answer to a review bottleneck is to let AI review. The paper checks how far that has gone. As of July 2026, 79.1% of firms had used AI tools in code review. But on the intensive margin, only 23.3% of all review comments were AI-generated and only 10.8% of pull requests received at least one AI comment. The authors conclude the bottleneck persists and humans stay in the loop, which fits the interviews: one senior engineer says AI review tools lack the comprehension of the whole feature.
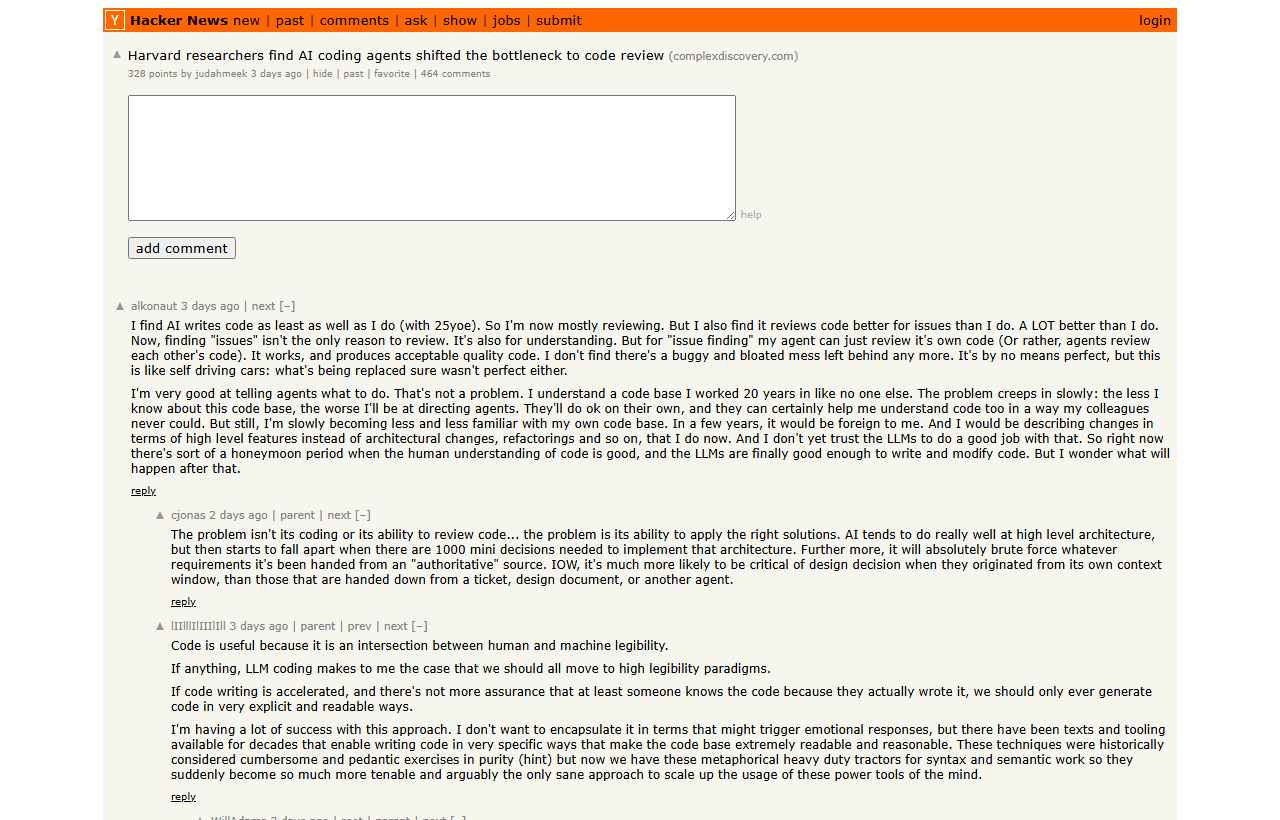
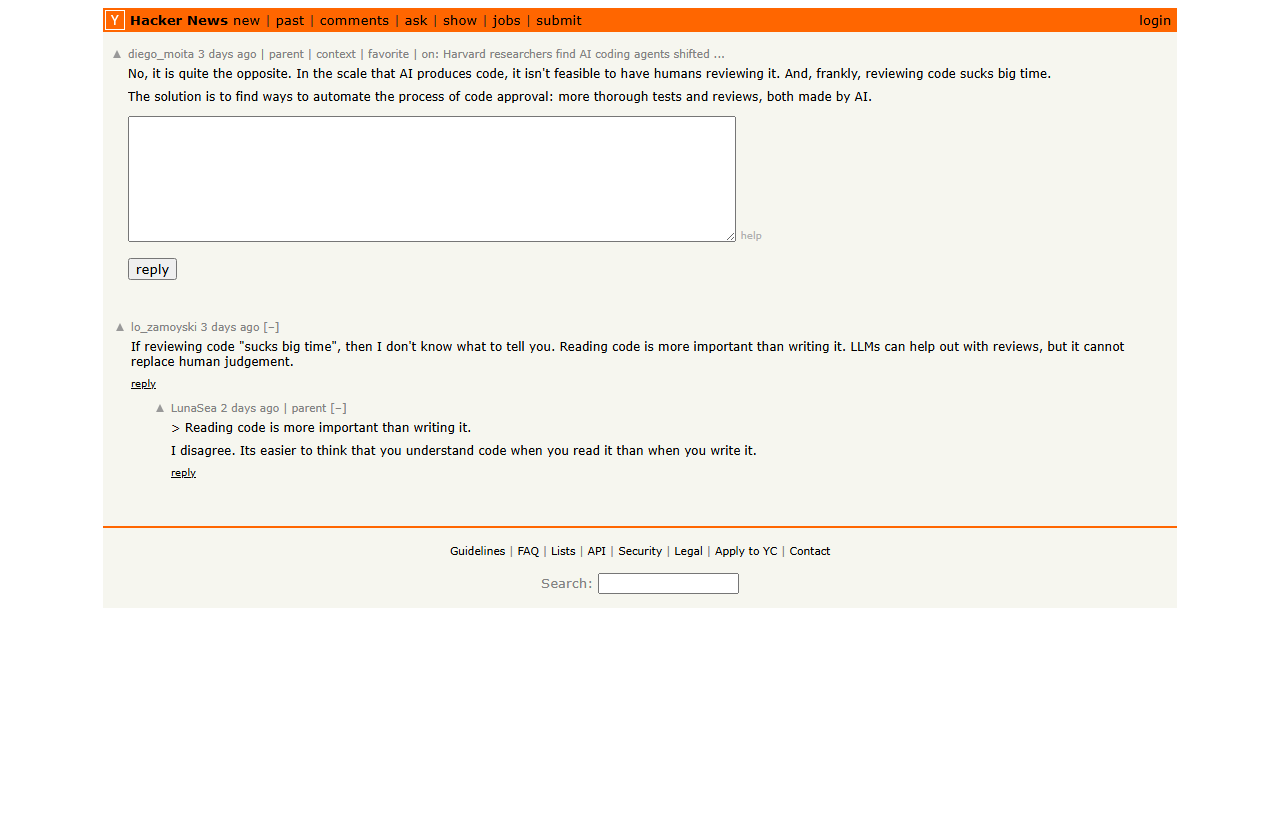
Hacker News readers split on whether that should change. One commenter argued that automating approval with more tests and AI review is the way out at this scale (50540233); another with 25 years of experience said an agent reviews his code for issues better than he does, but warned that they are becoming less familiar with their own code base (50543695). The paper cannot settle this: it measures how much AI review is used, not how good it is. JAVIS's own guide to making Claude Code prove its work covers one vendor's approach and its self-reported numbers.
The model turns the measurements into estimates for things nobody observed, and into forecasts that depend on two assumptions.
The authors build a two-stage model (write code, then review it) and fit it to their event-study results. It estimates what the data cannot show directly. For agents it infers that coding productivity rose 73.7% while review productivity fell 7.0% (marginally insignificant), and that firms moved labor out of coding (-22.7%) and into review (+43.4%). These are model-implied numbers, not measurements.
The forecasts then depend on whether review gets faster as quickly as coding. If review productivity stays fixed, the model has output rising 57.8% by 2031 and employment falling 10.3%, with output levelling off near that level from late 2027 and the share of labor devoted to review reaching its ceiling by late 2028. If review productivity keeps pace with coding, output rises 341.4% and employment falls 76.2%. The authors call these bounds. A second assumption is software demand: employment rises only if the price elasticity of demand is above 3.68, while published estimates for software products run from 1.50 to 3.73 with a mean of 2.27, at which the model gives output +16.1% and employment -13.2%.
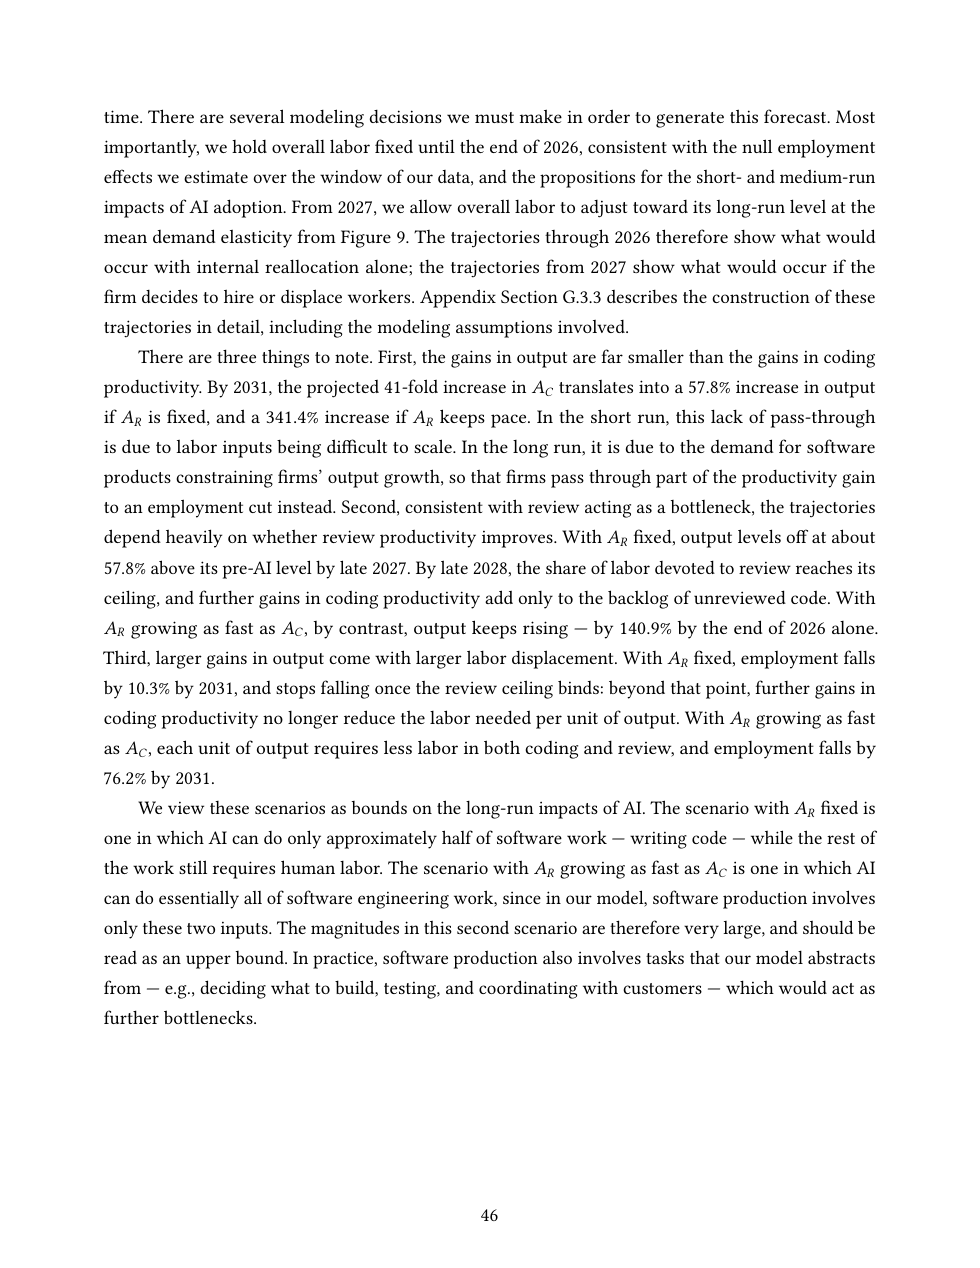
The paper has had at least three versions in ten months, and the review baseline changed from 7.03 days to 3.56.
This is a living working paper. The PDF behind this guide is dated Nov 19, 2026 and says the first version was Jan 7, 2026. ComplexDiscovery's news analysis, dated Oct 13, 2026, describes a version dated Aug 4, 2026 with a different sample (718 firms and 725,938 workers, data through March 2026). Its numbers differ from the Nov 19 version in size and in baseline, as the table shows. The August PDF is not covered here; the left column is as reported by ComplexDiscovery.
Swipe sideways to see every column.
| Measure | Aug 4 version (per ComplexDiscovery) | Nov 19 version (paper PDF) |
|---|---|---|
| Firms and workers | 718 firms, 725,938 workers | 655 firms, 720,542 workers |
| Data window ends | March 2026 | Aug 2026 |
| Lines of code, agents | about +30% | +44.0% (marginally insignificant) |
| Pull requests opened, agents | about +23% | +35.7% |
| Submit to merge, agents | +49% (3.45 days on a 7.03 day baseline) | +56.1% (1.99 days on a 3.56 day baseline) |
| Share of firms using AI review | nearly 80% by March 2026 | 79.1% as of July 2026 |
Two readings are fair. The direction is the same in both versions: more code, little more finished work, slower review. But a reader quoting a single percentage should name the version, and the baseline change (7.03 days to 3.56) could reflect a different review measure or sample, which this guide cannot confirm. ComplexDiscovery also notes an earlier Jellyfish summary of a preliminary version that said code quality did not seem to be suffering, while the current paper reads the rise in review comments as a possible sign of lower draft quality. Those Jellyfish posts are not covered here.

Common ways this paper gets summarized, and what the paper itself supports.
Swipe sideways to see every column.
| Claim in circulation | What the paper says | JAVIS status (Nov 21, 2026) |
|---|---|---|
| AI agents make teams slower | Review took 56.1% longer after agent adoption; finished work did not measurably fall, and issues and epics point upward | Not supported as stated: slower review, not slower teams |
| Review is the only bottleneck | Review is the one the data can see; the model abstracts from planning, testing and customer work, which the authors say would be further bottlenecks | Overstated |
| AI adds no finished work | Issues +13.7% and epics +18.0% for agents, marginally insignificant, with limits ruling out above 30.7% and 41.5% | Not zero; imprecise |
| Agents did not change jobs | Employment estimates are noisy (agents -2.6%, range -15.6% to 10.5%); the paper does not attribute changes | No detectable effect, but wide |
| AI review tools did not help | AI wrote 23.3% of comments and 10.8% of pull requests got an AI comment; effect of the tools on review time is not measured | Not tested by the paper |
| Code quality is worse | More comments per pull request and a rise in formal change requests that is marginally insignificant; bug reports per worker not significantly changed, point estimates slightly negative | Ambiguous; the paper reads comments as a possible quality signal |
| The 2031 forecasts are what will happen | Model scenarios the authors call bounds, with an assumed exponential trend and elasticity estimates from games and apps | Model output, not measurement |
What a 56.1% longer review wait means for a ten-engineer team, in pull requests in flight.
Illustrations built from the paper's averages under stated assumptions. A real team will differ, and the paper reports firm averages, not any single team.
Extra pull requests per month
The paper's agent estimates are 1.73 extra pull requests opened and 1.08 extra merged per worker per month. For ten engineers that is about 17.3 extra opened and 10.8 extra merged per month, a gap of about 6.5 that has not been merged. The paper puts the merged share of the extra ones at about 62.7%, against 86.1% at baseline.
Pull requests in flight (Little's law)
Take ten engineers at the paper's baseline of 4.83 pull requests per worker per month, about 11 a week, with a 3.56 day wait. By Little's law the average number in flight is the arrival rate times the wait: 11 / 7 = 1.57 per day, times 3.56 = about 5.6 open at any moment. After agents, arrivals rise 35.7% to 14.9 a week and the wait rises to 5.55 days: 14.9 / 7 = 2.13 per day, times 5.55 = about 11.8. That is 2.1 times as many open pull requests, from a 35.7% rise in arrivals and a 56.1% rise in the wait. The assumptions are even arrivals, calendar days and the paper's mean wait.
Why the second number matters
A pull request in flight is code that is written but not shipped, and it keeps ageing against the main branch. The paper does not measure merge conflicts, but the queue growth in the illustration is the mechanism it describes: faster writing raises arrivals, and the review wait grows faster than the arrivals do.
Measure the queue first. Five numbers from your own Git host tell you which of the paper's channels you are in.
These are JAVIS suggestions drawn from the paper's mechanisms. JAVIS has not tested them on a team, and the paper does not test remedies.
Swipe sideways to see every column.
| Measure | Where to get it | What a rise suggests |
|---|---|---|
| Time to first review | Pull request open time to first review event | Volume channel: not enough reviewer capacity |
| Time in active review | First review to merge | Quality channel: drafts need more correction |
| Comments per pull request | Review comment count | Quality channel, or reviewers raising the bar after outages |
| Pull requests open at once | Open pull request count, weekly | Queue is building even if merges look flat |
| Reviewer concentration | Share of reviews done by the top three reviewers | The senior-approval trap the paper describes |
Limit open pull requests per author so agents cannot raise arrivals faster than review can absorb them.
The paper finds 82.8% of reviews go to people who know the code. Pair reviewers on unfamiliar areas so the pool grows.
Only 10.8% of pull requests in the paper got an AI comment. Run it before a human looks, and keep a human on the final approval.
Tests and a verification step before submit reduce active review time if the quality channel is the cause. See the verification guide.
Track pull requests merged and issues resolved next to lines written, so a rising code number is not mistaken for delivery.
Hacker News: agreement that review is hard, disagreement on whether humans should still do it.
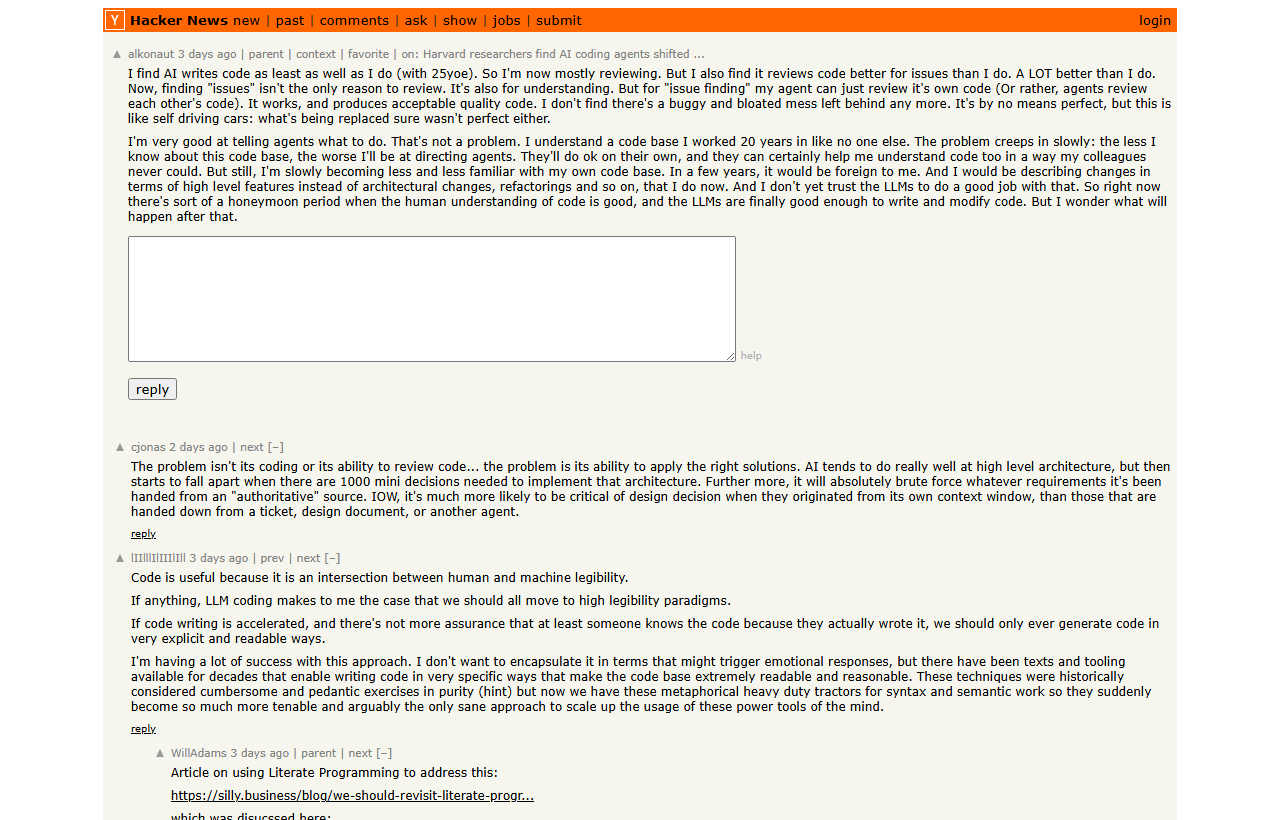
The story (item 50538303) links ComplexDiscovery's Oct 13 article, which covers an earlier version of the paper. It was submitted on Nov 17, 2026 and had 328 points and 464 comments on Nov 21. Commenters wrote on Nov 17 and 18, before the Nov 19 version existed. The submitter noted that earlier submissions got little attention, probably because of the paper's title (50538304). Below are summaries of six comments, in the commenters' own framing, not JAVIS's view.
The result raises demand for programmers who can read and analyse code, not only write it.
Replying to that comment: the opposite is true; at this scale humans cannot review it all, so automate approval with stronger tests and AI review.
Reviews were neglected before AI because people were busy and not rewarded for them; LLMs catch trivial patterns but judgement still matters.
Many reviews only skim and give false confidence; tests, canaries and QA catch mistakes better than review. Separately, they run AI reviewers several times on each pull request.
With 25 years of experience: says AI writes code as well as they do and finds issues in review a lot better than they do, but less familiarity with the code base makes directing agents harder over time.
Models say they follow the specification, but closely reviewed code in performance or security sensitive work is often poor.
One more comment is a useful counterweight to the paper's average: a developer who runs parallel agents says the day ends with decision fatigue from the number of choices agents ask for (50542141). That is anecdote, not data, but it points to a human limit that the paper's review-time measure would only show indirectly.
Where this guide, and the paper, stop.
- Not peer reviewed. The paper is a job market paper. There is no sign of completed peer review as of Nov 21, 2026, and the numbers have changed between versions.
- Proprietary data. Only Jellyfish client firms that consented are in the data, and outsiders cannot re-run the analysis. The paper says take-up figures are lower bounds, and ComplexDiscovery adds that use through individual licenses goes unrecorded.
- Observational design. Adoption timing is argued to be plausibly unrelated to growth, but if a hidden factor remains the authors expect it to overstate AI effects, not understate them.
- Data partner interest. Jellyfish sells analytics about AI impact. The paper says Jellyfish reviewed the manuscript only to check for proprietary disclosure; ComplexDiscovery notes the authors have also published on Jellyfish's blog.
- Marginal significance. Lines of code, issues, epics and several review measures are marginally insignificant in the paper, so they are best read as directions with wide ranges.
- Software, not other work. The paper studies engineering teams. It says its model generalizes, but it measures only software.
- No hands-on test. JAVIS did not re-run the analysis, access Jellyfish data or test any coding agent. Illustrations in section 11 are JAVIS calculations on the paper's averages, not measurements.
- Only the paper PDF is covered in full. The earlier version and the Jellyfish posts are described only through ComplexDiscovery.
A short decision list.
- Lead an engineering team that is buying or rolling out agent seats
- Own the review process or the merge queue
- Need a source for a board or budget discussion, with its caveats stated
- Want proof that agents help or harm your team (this is an average across firms)
- Plan to quote the 2031 forecasts as predictions
- Need a peer reviewed citation
Five actions.
No affiliate links, and nothing to buy.
The paper is free to read. JAVIS has no relationship with the authors, Harvard or Jellyfish, and this guide contains no affiliate links. The Jellyfish icon on the cover identifies the data partner and does not imply endorsement. The paper lists its funders as the Stripe Economics of AI Fellowship, a Harvard Kennedy School program and the Schmidt Sciences AI at Work Program.
Rolling out coding agents? Read these next.


Questions people ask about the Harvard code review paper.
What did the paper find?
After firms adopted AI coding agents, code output rose (pull requests opened +35.7% at month 12), finished work rose much less and not significantly (issues +13.7%, epics +18.0%), and review took longer (submit to merge +56.1%). The authors call review the bottleneck.
Does it prove agents slow teams down?
No. It reports an association in observational data from 655 firms. Review time rose, but the paper does not find that finished work fell.
Why do the numbers differ between sources?
The paper has been revised. ComplexDiscovery describes an August version with 718 firms and a 49% review slowdown on a 7.03 day baseline; the Nov 19 version reports 56.1% on 3.56 days.
Is it peer reviewed?
Not as far as JAVIS can tell. It is a Harvard job market paper, and the data partner reviewed it only to check for disclosure of proprietary data.
Do AI code review tools fix the bottleneck?
The paper does not measure that. It reports that 79.1% of firms had used AI review tools by July 2026, but AI wrote only 23.3% of review comments.
Did JAVIS test this?
No. The guide uses the paper PDF, a news analysis and the Hacker News thread, and did not re-run the analysis or test any coding agent. All as of Nov 21, 2026.
Where this came from, and when.
Paper: Fiona Chen and James Stratton, "Artificial Intelligence in the Firm: Bottlenecks in Software Production", version of Nov 19, 2026, fion.ac/jellyfish.pdf, as of Nov 21, 2026. Author site: fion.ac.
News analysis: ComplexDiscovery, Harvard researchers find AI coding agents shifted the bottleneck to code review, dated Oct 13, 2026, about an earlier version, as of Nov 21, 2026.
Hacker News: story 50538303 with comments 50538304, 50538349, 50540233, 50540261, 50541889, 50543695, 50544849 and 50542141, as of Nov 21, 2026.
Data partner: jellyfish.co (icon on the cover), as of Nov 21, 2026.
Images: screenshots of the pages above and pages of the paper PDF taken by JAVIS on Nov 21, 2026; charts, diagrams and the timeline drawn by JAVIS from the cited numbers. The Fit Score is editorial judgment, not a benchmark.
Not covered: hands-on tests of any agent, the August version of the paper itself, Jellyfish's own posts, re-analysis of the data and legal or hiring advice.